From The Star: Public Bank Bhd chairman Tan Sri Teh Hong Piow to retire
Some snippets:
Public Bank Bhd chairman Tan Sri Teh Hong Piow will leave his post on Jan 1, 2019 but will remain as the bank’s adviser.
“The details relating to the appointment of the new chairman of Public Bank will be announced at an appropriate time,” the bank said in a statement.
Teh will assume the title “chairman emeritus” after he relinquishes his position as chairman of Public Bank.
This, according to the bank, is in recognition of his “par excellence contributions” over the past 51 years since he founded Public Bank on Dec 30, 1965.
He would also remain as an adviser.
Teh is also retiring from his role as chairman of Public Islamic Bank Bhd and Public Investment Bank Bhd with effect from Jan 1, 2018, but would stay on as non-executive director in both wholly-owned subsidiaries of Public Bank with effect from the same day.
“The smooth transitions of the succession of the chairmanships of Public Bank, Public Islamic Bank and Public Investment Bank are in place,” the group said.
Public Bank under Teh's leadership has been one of the biggest success stories on Bursa, may be the best, but definetely in the top one percent group.
I only have data going back to 1987, over that 30-year timespan Public Bank compounded 16.4% (vs. 8.4% of the KLCI (both total return, taking dividends into account).
That means that RM 10,000 invested in Public Bank in 1987 is worth RM 1,014,000 now, while RM 10,000 invested in the KLCI is worth now RM 118,600, an outperformance of about 8.5 times.
Public Bank itself is a component of the KLCI, so relative to the other 29 counters it would have done even slightly better.
All very impressive, and one good example how much a succesful buy-and-hold strategy through an investment in a good quality company can yield. No wonder there are a lot of happy faces at the yearly AGM meetings.
Public bank has never reported a loss, not even in the horrific Asian crisis of 1997/98.
Showing posts with label long-term investing. Show all posts
Showing posts with label long-term investing. Show all posts
Wednesday, 2 August 2017
Friday, 25 November 2016
PNB reveals secret of how it makes money to pay high dividends
Article in The Star: "PNB reveals secret of how it makes money to pay high dividends"
That is indeed a catchy heading.
I have to admit, I have been a sceptic of the PNB funds, both regarding the high returns, the absence of down years and the fact that so many people borrow money to invest in these funds.
The problem with the article in The Star is, that nowhere is exactly revealed to the reader how PNB does make money to pay its high dividends. That is disappointing, to say the least, because that seems to have been the purpose for the meeting according to the title of the article.
Some of the returns of PNB funds can be found here and in other postings in the same blog.
I notice that the returns are getting lower, from the juicy double digit returns in the nineties to returns in the high single digits in this century.

But even those high single digits are much higher than average long term Malaysian share market returns.
I have written before about two subjects that seem relevant to this discussion:
I hope PNB will share its presentation (hopefully with lots of numbers to digest) not only with journalists but also with the Malaysian public.
That is indeed a catchy heading.
I have to admit, I have been a sceptic of the PNB funds, both regarding the high returns, the absence of down years and the fact that so many people borrow money to invest in these funds.
The problem with the article in The Star is, that nowhere is exactly revealed to the reader how PNB does make money to pay its high dividends. That is disappointing, to say the least, because that seems to have been the purpose for the meeting according to the title of the article.
Some of the returns of PNB funds can be found here and in other postings in the same blog.
I notice that the returns are getting lower, from the juicy double digit returns in the nineties to returns in the high single digits in this century.

But even those high single digits are much higher than average long term Malaysian share market returns.
I have written before about two subjects that seem relevant to this discussion:
- Bursa: long term returns: "My best overall guess of the long term yield including dividends and costs incurred of a portfolio is in the range of 4-5% per year"
- Poor earnings growth for Bursa listed companies (5): "At the moment it looks like that the [2016] earnings will come in around RM 53 Billion, lower than the 2012 results, about 12% lower than the 2014 results"
I hope PNB will share its presentation (hopefully with lots of numbers to digest) not only with journalists but also with the Malaysian public.
Thursday, 5 February 2015
Long-term investors should know about short selling skills
Great article by "ContrarianValue Edge":
"What Long Term Investors Can and SHOULD LEARN From Short Sellers"
Some snippets:
Let me make it clear at the outset that I had never done short selling nor do I plan to do in future. But I found principles of short selling technique to be equally helpful to long-term investors. For short sellers the maximum upside is 100% whereas downside is unlimited. These asymmetrical returns force short sellers to be much more diligent and conservative compared to long only investors. I was surprised to note that most successful short sellers never short any stock merely on over-valuation. I am not talking here about short sellers who short a stock in the morning and cover their position by the end of the day. I am talking about short sellers, who after deep analysis create a position and hold on to it until their conviction pays off.
Charlie Munger once said, ‘All I ever want to know is where I’m going to die, so I never go there’. My sole attempt at studying short selling technique is to find what successful short sellers look for in a good short and to avoid such stocks.
Successful short sellers look for the following before they decide to short any stock:
Many interesting links are also to be found in the above article.
A good (albeit almost 20 years old) book is "The Art of Short Selling" by Kathryn Staley:
"What Long Term Investors Can and SHOULD LEARN From Short Sellers"
Some snippets:
Let me make it clear at the outset that I had never done short selling nor do I plan to do in future. But I found principles of short selling technique to be equally helpful to long-term investors. For short sellers the maximum upside is 100% whereas downside is unlimited. These asymmetrical returns force short sellers to be much more diligent and conservative compared to long only investors. I was surprised to note that most successful short sellers never short any stock merely on over-valuation. I am not talking here about short sellers who short a stock in the morning and cover their position by the end of the day. I am talking about short sellers, who after deep analysis create a position and hold on to it until their conviction pays off.
Charlie Munger once said, ‘All I ever want to know is where I’m going to die, so I never go there’. My sole attempt at studying short selling technique is to find what successful short sellers look for in a good short and to avoid such stocks.
Successful short sellers look for the following before they decide to short any stock:
- Business : Secular problems or fundamental change in the nature of business.
- People: Dishonest and incompetent management.
- Balance Sheet: Higher leverage is preferred.
- Profit & Loss account: Quality & Sustainability of earnings. Simple overstatement of earnings is not enough. Short sellers are looking for cases where economic reality is significantly divorced from the accounting presentation of the business.
- Price: Valuation is given least preference by most short sellers.
Many interesting links are also to be found in the above article.
A good (albeit almost 20 years old) book is "The Art of Short Selling" by Kathryn Staley:
Sunday, 29 June 2014
Asian fund managers (3)
One kind reader pointed me at the following book:


The book (written in 1994, published in 1995) seems to be out of stock. I noticed some second-hand prices which seem to be on the high side, readers might want to try their luck at a larger library. Unfortunately, I have never owned or read the book, but found the following review by "Henry":
While a little dated now, in the style of John Train's "Money Masters" books, this tome recounts the modus operandi of consistent stand-out-performance investors in Asia. It includes some well know subjects (eg Dr Doom, Marc Faber) and some less well profiled. The author herself could easily be among them - for she later formed an open ended Asian fund which over the last 12 years has compounded at a rate of more than 28% pa (hence my interest at this late stage in reading her work).
Interesting is the following post, "Nuggets from my book", written by the author herself (December 1998), after the Asian crisis but before the internet implosion.
Tuesday, 13 May 2014
Rule of 20: would it also work in Malaysia?
"A measure of stock valuations called the Rule of 20 states that the stock market is fairly valued when the sum of the average price-earnings ratio and the rate of inflation is equal to 20. Above that level, stocks begin to get expensive; below it, they’re bargains."

The above from Bloomberg BusinessWeek.
The rationale:
In Malaysia the PE is around 18 (at least, that is what I read recently).
The inflation is officially about 2%, I guess it is around 5-7%.
In other words, according to the Rule of 20, I think that shares are slightly overvalued.
The above from Bloomberg BusinessWeek.
The rationale:
- The higher the PE, the lower the Earnings Yield, the less attractive the valuations are;
- The higher inflation, the higher the interest rates, the more attractive is the risk free alternative (fixed deposit) for investing.
In Malaysia the PE is around 18 (at least, that is what I read recently).
The inflation is officially about 2%, I guess it is around 5-7%.
In other words, according to the Rule of 20, I think that shares are slightly overvalued.
Tuesday, 25 March 2014
The Fed, Luck and Skill, History of Money
Three interesting articles with some snippets (for the full articles, please click on the links):
Jeremy Grantham: The Fed is killing the recovery
It's quite likely that the recovery has been slowed down because of the Fed's actions. Of course, we're dealing with anecdotal evidence here because there is no control. But go back to the 1980s and the U.S. had an aggregate debt level of about 1.3 times GDP. Then we had a massive spike over the next two decades to about 3.3 times debt. And GDP over that time period has been slowed. There isn't any room in that data for the belief that more debt creates growth.
The Bernanke put -- the market belief that if anything goes bad the Fed will come to the rescue -- has had a profound impact on people and how they act.
Yes, I agree that the Fed can manipulate stock prices. That's perhaps the only thing they can do. But why would you want to get an advantage from the wealth effect when you know you are going to have to give it all back when the Fed reverses course. At the same time, the Fed encourages steady increasing leverage and more asset bubbles. It's clear to most investing professionals that they can benefit from an asymmetric bet here. The Fed gives them very cheap leverage on the upside, and then bails them out on the downside. And you should have more confidence of that now. The only ones who have really benefited from QE are hedge fund managers.
So are you putting your client's money into the market?
No. You asked me where the market is headed from here. But to invest our clients' money on the basis of speculation being driven by the Fed's misguided policies doesn't seem like the best thing to do with our clients' money.
We invest our clients' money based on our seven-year prediction. And over the next seven years, we think the market will have negative returns. The next bust will be unlike any other, because the Fed and other centrals banks around the world have taken on all this leverage that was out there and put it on their balance sheets. We have never had this before. Assets are overpriced generally. They will be cheap again. That's how we will pay for this. It's going to be very painful for investors.
Luck and Skill Untangled: The Science of Success

It turns out that investors earn dollar-weighted returns that are less than the average return of mutual funds. Over the last 20 years through 2011, for instance, the S&P 500 has returned about 8 percent annually, the average mutual fund about 6 to 7 percent (fees and other costs represent the difference), but the average investor has earned less than 5 percent. At first blush it seems hard to see how investors can do worse than the funds they invest in. The insight is that investors tend to buy after the market has gone up — ignoring reversion to the mean — and sell after the market has gone down — again, ignoring reversion to the mean. The practice of buying high and selling low is what drives the dollar-weighted returns to be less than the average returns. This pattern is so well documented that academics call it the “dumb money effect.”
A Brief History of Money
If the entire history of Homo sapiens was represented by a 24-hour clock, money would only have been around for the last 18 minutes. Because it connects people, it is arguably humankind's most important invention, up there with the printing press and the internet.

But, as George Goodman (a.k.a."Adam Smith") points out, “The trouble with paper money is that it rewards the minority that can manipulate money and makes fools of the generation that has worked and saved.” Under a fiat money system, higher inflation slowly confiscates savings. Wall Street and the financial sector have been viewed with scorn in the aftermath of the 2008 global financial crisis, but one positive development in the world of finance is that we no longer have a “minority” that can use money to their advantage—anyone can do it. For a long time, only the privileged rich could access global market opportunities, but thanks to innovations like exchange-traded funds and low-cost online trading accounts, participation in the global stock market is cheap and easy. Because of the now low barriers to entry, all investors can protect themselves from inflation and grow their wealth.
Born after 1980, millennials are the first complete generation of Americans born into a world of dollars without an anchor. No anchor means no check on inflation, no check on money printing, and therefore no check on the value of our U.S. dollar. With inflation eating away our purchasing power, we should invest in assets that grow at the highest real rate (after-inflation) over time.

Over the long run stocks have outperformed bonds and bills, usually by wide margins[xi]. And while U.S. bills and bonds did provide slightly positive returns after inflation during this period, bonds and bills in other countries lost money between 1900 and 2012. Investments in supposedly “safe” short term bills lost purchasing power in Germany, Japan, France, Italy, Belgium, Finland and Austria. In the U.S. and in countries abroad, bills and bonds have failed to help investors build wealth.
Jeremy Grantham: The Fed is killing the recovery
It's quite likely that the recovery has been slowed down because of the Fed's actions. Of course, we're dealing with anecdotal evidence here because there is no control. But go back to the 1980s and the U.S. had an aggregate debt level of about 1.3 times GDP. Then we had a massive spike over the next two decades to about 3.3 times debt. And GDP over that time period has been slowed. There isn't any room in that data for the belief that more debt creates growth.
The Bernanke put -- the market belief that if anything goes bad the Fed will come to the rescue -- has had a profound impact on people and how they act.
Yes, I agree that the Fed can manipulate stock prices. That's perhaps the only thing they can do. But why would you want to get an advantage from the wealth effect when you know you are going to have to give it all back when the Fed reverses course. At the same time, the Fed encourages steady increasing leverage and more asset bubbles. It's clear to most investing professionals that they can benefit from an asymmetric bet here. The Fed gives them very cheap leverage on the upside, and then bails them out on the downside. And you should have more confidence of that now. The only ones who have really benefited from QE are hedge fund managers.
So are you putting your client's money into the market?
No. You asked me where the market is headed from here. But to invest our clients' money on the basis of speculation being driven by the Fed's misguided policies doesn't seem like the best thing to do with our clients' money.
We invest our clients' money based on our seven-year prediction. And over the next seven years, we think the market will have negative returns. The next bust will be unlike any other, because the Fed and other centrals banks around the world have taken on all this leverage that was out there and put it on their balance sheets. We have never had this before. Assets are overpriced generally. They will be cheap again. That's how we will pay for this. It's going to be very painful for investors.
Luck and Skill Untangled: The Science of Success
It turns out that investors earn dollar-weighted returns that are less than the average return of mutual funds. Over the last 20 years through 2011, for instance, the S&P 500 has returned about 8 percent annually, the average mutual fund about 6 to 7 percent (fees and other costs represent the difference), but the average investor has earned less than 5 percent. At first blush it seems hard to see how investors can do worse than the funds they invest in. The insight is that investors tend to buy after the market has gone up — ignoring reversion to the mean — and sell after the market has gone down — again, ignoring reversion to the mean. The practice of buying high and selling low is what drives the dollar-weighted returns to be less than the average returns. This pattern is so well documented that academics call it the “dumb money effect.”
A Brief History of Money
If the entire history of Homo sapiens was represented by a 24-hour clock, money would only have been around for the last 18 minutes. Because it connects people, it is arguably humankind's most important invention, up there with the printing press and the internet.
But, as George Goodman (a.k.a."Adam Smith") points out, “The trouble with paper money is that it rewards the minority that can manipulate money and makes fools of the generation that has worked and saved.” Under a fiat money system, higher inflation slowly confiscates savings. Wall Street and the financial sector have been viewed with scorn in the aftermath of the 2008 global financial crisis, but one positive development in the world of finance is that we no longer have a “minority” that can use money to their advantage—anyone can do it. For a long time, only the privileged rich could access global market opportunities, but thanks to innovations like exchange-traded funds and low-cost online trading accounts, participation in the global stock market is cheap and easy. Because of the now low barriers to entry, all investors can protect themselves from inflation and grow their wealth.
Born after 1980, millennials are the first complete generation of Americans born into a world of dollars without an anchor. No anchor means no check on inflation, no check on money printing, and therefore no check on the value of our U.S. dollar. With inflation eating away our purchasing power, we should invest in assets that grow at the highest real rate (after-inflation) over time.
Over the long run stocks have outperformed bonds and bills, usually by wide margins[xi]. And while U.S. bills and bonds did provide slightly positive returns after inflation during this period, bonds and bills in other countries lost money between 1900 and 2012. Investments in supposedly “safe” short term bills lost purchasing power in Germany, Japan, France, Italy, Belgium, Finland and Austria. In the U.S. and in countries abroad, bills and bonds have failed to help investors build wealth.
Monday, 10 February 2014
"In investing, you get what you don’t pay for"
I read the interesting article "The Mutual Fund Walking Dead", with the following eye-opening graph:

"The underperformance of active mutual funds is well publicized at this point. These graphs are just another nail in the coffin.
What got my attention with this data is that it shows how many active mutual funds just completely go out of business. Basically, they get shut down or merge with another fund.
The first study shows that only 55% of active mutual funds survived the 15 year period through 2012. Somehow, 36% survived but underperformed. And only 18% both survived and outperformed their index.
The second graph shows how much worse active fund underperformance is once you add in the graveyard funds. Nearly all of these asset classes go to roughly 80% underperformance against their index over 10 years including the dead funds.
In Don’t Count on It, John Bogle informs readers that there were only 49 stock mutual funds in 1945. By 2006, that number had ballooned to 4,200.
He also shared that around 50% of the mutual funds created in the 1990s failed and 1,000 funds failed in the 2000-04 period.
So not only are you competing against simple, low-cost index funds when trying to choose active funds. You also have to dodge the walking dead zombie funds that end up dying.
Mutual fund companies will continue to churn out funds that mirror the hottest performing sector or asset class. If they don’t work those funds will be swept aside for the next revolutionary idea.
Don’t take the bait."
The graphs are from Vanguard, the company founded by John Bogle.
An interesting interview by The New York Times with Bogle can be found here, some excerpts (emphasis mine):
Start with the economy, the ultimate source of long-term stock market returns. “The economy has clouds hovering over it,” Mr. Bogle says. “And the financial system has been damaged. The risk of a black-swan event — of something unlikely but apocalyptic — is small, but it’s real.”
Even so, he says, long-term investors must hold stocks, because risky as the market may be, it is still likely to produce better returns than the alternatives.
“Wise investors won’t try to outsmart the market,” he says. “They’ll buy index funds for the long term, and they’ll diversify.
“But diversify into what? They need alternatives, bonds, for the most part. What’s so frightening right now is that the alternatives to equities are so poor.”
In the financial crises of the last several years, he says, investors have flocked to seemingly safe government bonds, driving up prices and driving down yields. The Federal Reserve and other central banks have been pushing down interest rates, too.
But low yields today predict low returns later, he says, and “the outlook for bonds over the next decade is really terrible.”
Dark as this outlook may be, he says, people need to “stay the course” if they are to have hope of buying homes or putting children through college or retiring in comfort.
Too much money is aimed at short-term speculation — the seeking of quick profit with little concern for the future. The financial system has been wounded by a flood of so-called innovations that merely promote hyper-rapid trading, market timing and shortsighted corporate maneuvering. Individual investors are being shortchanged, he writes.
He is still preaching the gospel of long-term, low-cost investing. “My ideas are very simple,” he says: “In investing, you get what you don’t pay for. Costs matter. So intelligent investors will use low-cost index funds to build a diversified portfolio of stocks and bonds, and they will stay the course. And they won’t be foolish enough to think that they can consistently outsmart the market.”
He advocates taxes to discourage short-term speculation. He wants limits on leverage, transparency for financial derivatives, stricter punishments for financial crimes and, perhaps most urgently, a unified fiduciary standard for all money managers: “A fiduciary standard means, basically, put the interests of the client first. No excuses. Period.”
Monday, 19 August 2013
Buffett's Billion dollar memo
Article in Fortune titled: "The 1975 Buffett memo that saved WaPo's pension".
One of the (many) things that surprised people about the recent $250 million sale of the Washington Post to Amazon (AMZN) founder Jeff Bezos was the health of the Washington Post's pension plan. At a time when most pension plans are struggling, the Post has $1 billion more than it needs. (As part of the deal, Bezos is getting $333 million for the new newspaper company's pension fund, which Post chairman Don Graham says is $50 million more than Bezos needs to meet his current obligations.) Graham told Fortune there are two words that explain why: Warren Buffett.
In October 1975, Buffett sent The Washington Post's (WPO) then chairman and CEO Katharine Graham a memo about the brewing problems in pension plans, and Buffett's suggestions for how the Post could avoid them. Graham took Buffett's advice, and the rest ... you know. For a story in the current issue of Fortune, Buffett talked about the story of the Washington Post's pension plan ("Kay Graham was a smart woman," says Buffett) and shared for the first time publicly the letter that he sent Graham.
The letter alone is quite amazing. In it, Buffett identifies the pension problems that others would key in on only a decade or so later. But he also lays out perhaps for the first time -- Buffett was 45 when he wrote it and years away from attaining the investment fame he has today -- his philosophy behind what it takes to be a successful investor. His main pieces of advice: Think like an owner, look for a discount, and be patient.
Buffett's obvious wit and signature charm are evident throughout the letter. And there's an early version of Buffett's famous story of why investors shouldn't chase the hot fund managers and instead focus on how they got those returns:
"If above-average performance is to be their yard stick, the vast majority of investment managers must fail. Will a few succeed -- due to either to chance or skill? Of course. For some intermediate period of years a few are bound to look better than average due to chance -- just as would be the case if 1,000 'coin managers' engaged in a coin-flipping contest. There would be some 'winners' over a five or 10-flip measurement cycle. (After five flips, you would expect to have 31 with uniformly 'successful' records -- who, with their oracular abilities confirmed in the crucible of the marketplace, would author pedantic essays on subjects such as pensions.)"
[If the viewer below doesn't work properly then please first download the letter and then read it]
Wednesday, 31 July 2013
Investing in Gold
I have written several times about gold.
In The New York Times an article by Harvard professor N. Gregory Mankiw appeared:
"Budging (Just a Little) on Investing in Gold, should gold be a part of my portfolio?”

Here are the main points of the writer:
THERE ISN’T A LOT OF IT
The World Gold Council estimates that all the gold ever mined amounts to 174,100 metric tons. If this supply were divided equally among the world’s population, it would work out to less than one ounce a person.
Warren E. Buffett has a good way to illustrate how little gold there is. He has calculated that if all the gold in the world were made into a cube, its edge would be only 69 feet long. So the cube would fit comfortably within a baseball infield.
ITS REAL RETURN IS SMALL
Over the long run, gold’s price has outpaced overall prices as measured by the Consumer Price Index — but not by much. In another recent N.B.E.R. paper, the economists Robert J. Barro and Sanjay P. Misra reported that from 1836 to 2011, gold earned an average annual inflation-adjusted return of 1.1 percent. By contrast, they estimated long-term returns to be 1.0 percent for Treasury bills, 2.9 percent for long-term bonds and 7.4 percent for stocks.
Mr. Erb and Mr. Harvey presented a novel way of gauging gold’s return in the very long run: they compared what the Roman emperor Augustus paid his soldiers, measured in units of gold, to what we pay the military today.
ITS PRICE IS HIGHLY VOLATILE
Gold may offer an average return near that of Treasury bills, but its volatility is closer to that of the stock market. That has been especially true since President Richard M. Nixon removed the last vestiges of the gold standard. Mr. Barro and Mr. Misra report that since 1975, the volatility of gold’s return, as measured by standard deviation, has been about 50 percent greater than the volatility of stocks.
IT MARCHES TO A DIFFERENT BEAT A
n important element of an investment portfolio is diversification, and here is where gold really shines — pun intended — because its price is largely uncorrelated with stocks and bonds. Despite gold’s volatility, adding a little to a standard portfolio can reduce its overall risk.
Some comments by me:
I think gold (and other precious metals) should be a part of a diversified portfolio which contains (global) stocks, cash, short term and long term bonds and property (or land). At the moment the future returns for long term bonds do not look well, so its allocation should be minimal.
In The New York Times an article by Harvard professor N. Gregory Mankiw appeared:
"Budging (Just a Little) on Investing in Gold, should gold be a part of my portfolio?”

Here are the main points of the writer:
THERE ISN’T A LOT OF IT
The World Gold Council estimates that all the gold ever mined amounts to 174,100 metric tons. If this supply were divided equally among the world’s population, it would work out to less than one ounce a person.
Warren E. Buffett has a good way to illustrate how little gold there is. He has calculated that if all the gold in the world were made into a cube, its edge would be only 69 feet long. So the cube would fit comfortably within a baseball infield.
ITS REAL RETURN IS SMALL
Over the long run, gold’s price has outpaced overall prices as measured by the Consumer Price Index — but not by much. In another recent N.B.E.R. paper, the economists Robert J. Barro and Sanjay P. Misra reported that from 1836 to 2011, gold earned an average annual inflation-adjusted return of 1.1 percent. By contrast, they estimated long-term returns to be 1.0 percent for Treasury bills, 2.9 percent for long-term bonds and 7.4 percent for stocks.
Mr. Erb and Mr. Harvey presented a novel way of gauging gold’s return in the very long run: they compared what the Roman emperor Augustus paid his soldiers, measured in units of gold, to what we pay the military today.
They report remarkably little change over 2,000 years. The annual cost of one Roman legionary plus one Roman centurion was 40.9 ounces of gold. The annual cost of one United States Army private plus one Army captain has recently been 38.9 ounces of gold.
ITS PRICE IS HIGHLY VOLATILE
Gold may offer an average return near that of Treasury bills, but its volatility is closer to that of the stock market. That has been especially true since President Richard M. Nixon removed the last vestiges of the gold standard. Mr. Barro and Mr. Misra report that since 1975, the volatility of gold’s return, as measured by standard deviation, has been about 50 percent greater than the volatility of stocks.
IT MARCHES TO A DIFFERENT BEAT A
n important element of an investment portfolio is diversification, and here is where gold really shines — pun intended — because its price is largely uncorrelated with stocks and bonds. Despite gold’s volatility, adding a little to a standard portfolio can reduce its overall risk.
Some comments by me:
- Its return is small: this is measured against the S&P 500 from the US which has performed very well over the long run; however, most other share markets all over the world haven't returned that much, I think only the Australian market has beaten the US over the very long run. One example is the Chinese market, although the economy has boomed tremendously over the last 10-15 years, a foreign investor would not have made much money at all (one possible reason being the low standard of Corporate Governance, capitalism is still too young in China)
- Since abandoning of the gold standard, as could be expected (without the restriction that each USD had to be backed by gold) the US government embarked on a money printing campaign that increased in recent times since the 2008/9 global crisis; we might not yet have seen the end of this, which makes a decent case to hold gold since its supply is limited, while governments ability to print money out of nothing isn't
- The writer recommends to hold 2% of ones assets in gold, Marc Faber recommends a clearly higher percentage, more like 5-10% (possibly in combination with other precious metals)
I think gold (and other precious metals) should be a part of a diversified portfolio which contains (global) stocks, cash, short term and long term bonds and property (or land). At the moment the future returns for long term bonds do not look well, so its allocation should be minimal.
Wednesday, 1 May 2013
A comic book makes the case for Loews (amended version)
(Amended version, comments added in red at the end of the article)
Loews, a holding company based in the US, has done pretty well over the years. However, investors in general don't like holding companies much, the story is just not sexy. Often holding companies are trading at a discount compared to the sum of the value of the subsidiaries.
Therefore the CEO, Jim Tisch, suggested to use a comic book to teach potential investors about the value of the company.
The book is called "Lotta Value: Investment Hunter", and can be downloaded here.

Not everyone is that positive about the idea of using a comic book, an extract of Bloomberg can be found here:
One critic says that the comic “just looks dead. And the content is about as interesting as reading the ingredients on a processed food label.”
I am not that negative, but more interesting than the comic is the value investing story of this company, which can be found here.
A return of 15.5% over 50 years means that if someone would have invested $ 1,000 50 years ago then one would now be sitting on a capital worth of about $ 1,300,000 while the same amount invested in the S&P 500 would only have yielded $ 22,500, quite a difference.
RG commented: "As far as I understand, the S&P 500 historically returns approximately 8%-10% pa. So I wonder how the figure of $22,500 was arrived at over 50 years."
And RG is right, so it seems, based on this calculator. The difference in the 50 year annual return between 6.4% and 9.7% is the difference between price (without dividends) and price (dividends reinvested).
I think it is more fair to compare returns based on dividends reinvested. However, I am not sure if Loews' return includes dividends reinvested, if not then the real return would even be higher.
The calculator from the above website goes back as far as 1871. Annual returns are 4.2% (price excluding dividends) and 8.9% (dividends reinvested), giving prominence to the importance of dividends. Adjusted for inflation the difference is even larger, 2.0% and 6.7%.
The 10 year return for the S&P 500 is 5.7% resp. 7.8%, but the 13 year return is only 0.5% resp. 2.3%, stressing the importance of choosing a starting point for comparison wisely. I prefer to measure over a period as long as possible.
PERMANDU (the performance management delivery unit from the Malaysian government) compares its performance starting in 2009, but that is in the midst of the global recession. If I use Jan 2009 as a starting point for the S&P 500 then the returns become 14.8% and 17.2%, unrealistic high annual scores, about 10% higher than the averages, caused by exceptional circumstances. PERMANDU should acknowledge the importance of the starting point for its measurements, and warn the public that returns in the future (most likely) will not continue to be so good.
Wednesday, 6 March 2013
Long term graph of SP 500

I love long term graphs, this one is from the S&P 500 (USA), the grey areas are recessions.
It is impossible to time the market correctly, but somebody who was roughly right would have made a bomb:
- Buy the US market somewhere between 1980 and 1990
- Sell in 1999/2000
- Buy in 2002/2003
- Sell in 2007
- Buy in 2009
But even people who bought the market in 1980 and just held on to their shares would have done pretty well, they would have made about 15 times their money.
Wednesday, 6 February 2013
"This is going to end badly"
Interesting article from PFP Wealth Management can be found here.
Three interesting charts, two of which are from Dough Wakefield:

This chart looks rather scary. If companies ran into troubles in 2001/01 and 2008/09 but survived, then their valuations should be relatively cheaper now. But if companies did go bankrupt, then value was destroyed permanently for investors in those companies.
I am less negative than the writer of the article, shares are probably in general somewhat expensive, but not overvalued as much as in 2000 or 2007.

The above chart shows that high yield bonds also went up a lot. The article therefore poses the question:
"Straightforward analysis of these two charts happens to fire a torpedo into the current thesis that we should all be preparing for some kind of ‘Great Rotation’ out of bonds and into stocks. What are we all supposed to do if stocks and (in this case, high yield) bonds are both expensive?"
And another, intriguing question:
“Is it possible that the big banks, after never having more than $60 billion in excess reserves between 1957 (oldest date I could find on a Federal Reserve website) and the end of 2008, are sitting on more than $1.5 trillion at the end of 2012 because they are preparing for a massive DEFLATION of asset prices in the future ? What about big corporations, who recently reached their largest amount of cash on record ?”
That sounds indeed puzzling.
Another observation by the writer:
We note that Credit Suisse has now run up the white flag on gold, declaring that the precious metal “appears significantly overvalued”. By comparison to what, exactly ? Or as expressed in what, exactly ? We think Credit Suisse’s gold analysts understand as much about gold as Kermit the Frog or any other of the Muppets. The chart below, for example, shows the extent to which central banks have recently inflated their balance sheets:

Indeed, a remarkable correlation. The kind of chart that reminds me that countries that report extraordinary low inflation of 1% or 2% (Malaysia is one of those, but there are many others) might significantly under-report the real numbers.
And the last observation of Tim Price:
"So while we can state with a high degree of certainty that this mess really will end badly, we can’t state with any certainty over what time period it does so. So we are quite content to shelter in a variety of sensibly selected and genuinely disparate asset classes, and meanwhile pick fights with any and all comers who seem to have grave difficulty in distinguishing between nominal price returns and substantive, lasting value. Pay your “money”, and take your choice."
Three interesting charts, two of which are from Dough Wakefield:

This chart looks rather scary. If companies ran into troubles in 2001/01 and 2008/09 but survived, then their valuations should be relatively cheaper now. But if companies did go bankrupt, then value was destroyed permanently for investors in those companies.
I am less negative than the writer of the article, shares are probably in general somewhat expensive, but not overvalued as much as in 2000 or 2007.

The above chart shows that high yield bonds also went up a lot. The article therefore poses the question:
"Straightforward analysis of these two charts happens to fire a torpedo into the current thesis that we should all be preparing for some kind of ‘Great Rotation’ out of bonds and into stocks. What are we all supposed to do if stocks and (in this case, high yield) bonds are both expensive?"
And another, intriguing question:
“Is it possible that the big banks, after never having more than $60 billion in excess reserves between 1957 (oldest date I could find on a Federal Reserve website) and the end of 2008, are sitting on more than $1.5 trillion at the end of 2012 because they are preparing for a massive DEFLATION of asset prices in the future ? What about big corporations, who recently reached their largest amount of cash on record ?”
That sounds indeed puzzling.
Another observation by the writer:
We note that Credit Suisse has now run up the white flag on gold, declaring that the precious metal “appears significantly overvalued”. By comparison to what, exactly ? Or as expressed in what, exactly ? We think Credit Suisse’s gold analysts understand as much about gold as Kermit the Frog or any other of the Muppets. The chart below, for example, shows the extent to which central banks have recently inflated their balance sheets:
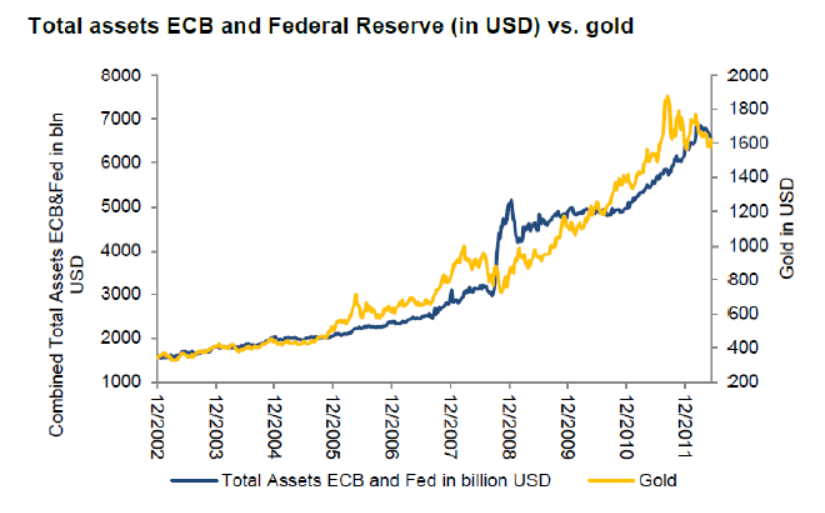
Indeed, a remarkable correlation. The kind of chart that reminds me that countries that report extraordinary low inflation of 1% or 2% (Malaysia is one of those, but there are many others) might significantly under-report the real numbers.
And the last observation of Tim Price:
"So while we can state with a high degree of certainty that this mess really will end badly, we can’t state with any certainty over what time period it does so. So we are quite content to shelter in a variety of sensibly selected and genuinely disparate asset classes, and meanwhile pick fights with any and all comers who seem to have grave difficulty in distinguishing between nominal price returns and substantive, lasting value. Pay your “money”, and take your choice."
Saturday, 11 February 2012
Warren Buffett: Why stocks beat gold and bonds
In an adaptation from his upcoming shareholder letter, the Oracle of Omaha explains why equities almost always beat the alternatives (bonds, gold, etc) over time.

By Warren Buffett
FORTUNE -- Investing is often described as the process of laying out money now in the expectation of receiving more money in the future. At Berkshire Hathaway (BRKA) we take a more demanding approach, defining investing as the transfer to others of purchasing power now with the reasoned expectation of receiving more purchasing power -- after taxes have been paid on nominal gains -- in the future. More succinctly, investing is forgoing consumption now in order to have the ability to consume more at a later date.
From our definition there flows an important corollary: The riskiness of an investment is not measured by beta (a Wall Street term encompassing volatility and often used in measuring risk) but rather by the probability -- the reasoned probability -- of that investment causing its owner a loss of purchasing power over his contemplated holding period. Assets can fluctuate greatly in price and not be risky as long as they are reasonably certain to deliver increased purchasing power over their holding period. And as we will see, a nonfluctuating asset can be laden with risk.
Investment possibilities are both many and varied. There are three major categories, however, and it's important to understand the characteristics of each. So let's survey the field.
Investments that are denominated in a given currency include money-market funds, bonds, mortgages, bank deposits, and other instruments. Most of these currency-based investments are thought of as "safe." In truth they are among the most dangerous of assets. Their beta may be zero, but their risk is huge.
Over the past century these instruments have destroyed the purchasing power of investors in many countries, even as these holders continued to receive timely payments of interest and principal. This ugly result, moreover, will forever recur. Governments determine the ultimate value of money, and systemic forces will sometimes cause them to gravitate to policies that produce inflation. From time to time such policies spin out of control.

Even in the U.S., where the wish for a stable currency is strong, the dollar has fallen a staggering 86% in value since 1965, when I took over management of Berkshire. It takes no less than $7 today to buy what $1 did at that time. Consequently, a tax-free institution would have needed 4.3% interest annually from bond investments over that period to simply maintain its purchasing power. Its managers would have been kidding themselves if they thought of any portion of that interest as "income."
For taxpaying investors like you and me, the picture has been far worse. During the same 47-year period, continuous rolling of U.S. Treasury bills produced 5.7% annually. That sounds satisfactory. But if an individual investor paid personal income taxes at a rate averaging 25%, this 5.7% return would have yielded nothing in the way of real income. This investor's visible income tax would have stripped him of 1.4 points of the stated yield, and the invisible inflation tax would have devoured the remaining 4.3 points. It's noteworthy that the implicit inflation "tax" was more than triple the explicit income tax that our investor probably thought of as his main burden. "In God We Trust" may be imprinted on our currency, but the hand that activates our government's printing press has been all too human.
High interest rates, of course, can compensate purchasers for the inflation risk they face with currency-based investments -- and indeed, rates in the early 1980s did that job nicely. Current rates, however, do not come close to offsetting the purchasing-power risk that investors assume. Right now bonds should come with a warning label.
Under today's conditions, therefore, I do not like currency-based investments. Even so, Berkshire holds significant amounts of them, primarily of the short-term variety. At Berkshire the need for ample liquidity occupies center stage and will never be slighted, however inadequate rates may be. Accommodating this need, we primarily hold U.S. Treasury bills, the only investment that can be counted on for liquidity under the most chaotic of economic conditions. Our working level for liquidity is $20 billion; $10 billion is our absolute minimum.
Beyond the requirements that liquidity and regulators impose on us, we will purchase currency-related securities only if they offer the possibility of unusual gain -- either because a particular credit is mispriced, as can occur in periodic junk-bond debacles, or because rates rise to a level that offers the possibility of realizing substantial capital gains on high-grade bonds when rates fall. Though we've exploited both opportunities in the past -- and may do so again -- we are now 180 degrees removed from such prospects. Today, a wry comment that Wall Streeter Shelby Cullom Davis made long ago seems apt: "Bonds promoted as offering risk-free returns are now priced to deliver return-free risk."
The second major category of investments involves assets that will never produce anything, but that are purchased in the buyer's hope that someone else -- who also knows that the assets will be forever unproductive -- will pay more for them in the future. Tulips, of all things, briefly became a favorite of such buyers in the 17th century.
This type of investment requires an expanding pool of buyers, who, in turn, are enticed because they believe the buying pool will expand still further. Owners are not inspired by what the asset itself can produce -- it will remain lifeless forever -- but rather by the belief that others will desire it even more avidly in the future.

The major asset in this category is gold, currently a huge favorite of investors who fear almost all other assets, especially paper money (of whose value, as noted, they are right to be fearful). Gold, however, has two significant shortcomings, being neither of much use nor procreative. True, gold has some industrial and decorative utility, but the demand for these purposes is both limited and incapable of soaking up new production. Meanwhile, if you own one ounce of gold for an eternity, you will still own one ounce at its end.
What motivates most gold purchasers is their belief that the ranks of the fearful will grow. During the past decade that belief has proved correct. Beyond that, the rising price has on its own generated additional buying enthusiasm, attracting purchasers who see the rise as validating an investment thesis. As "bandwagon" investors join any party, they create their own truth -- for a while.
Over the past 15 years, both Internet stocks and houses have demonstrated the extraordinary excesses that can be created by combining an initially sensible thesis with well-publicized rising prices. In these bubbles, an army of originally skeptical investors succumbed to the "proof " delivered by the market, and the pool of buyers -- for a time -- expanded sufficiently to keep the bandwagon rolling. But bubbles blown large enough inevitably pop. And then the old proverb is confirmed once again: "What the wise man does in the beginning, the fool does in the end."
Today the world's gold stock is about 170,000 metric tons. If all of this gold were melded together, it would form a cube of about 68 feet per side. (Picture it fitting comfortably within a baseball infield.) At $1,750 per ounce -- gold's price as I write this -- its value would be about $9.6 trillion. Call this cube pile A.
Let's now create a pile B costing an equal amount. For that, we could buy all U.S. cropland (400 million acres with output of about $200 billion annually), plus 16 Exxon Mobils (the world's most profitable company, one earning more than $40 billion annually). After these purchases, we would have about $1 trillion left over for walking-around money (no sense feeling strapped after this buying binge). Can you imagine an investor with $9.6 trillion selecting pile A over pile B?

Beyond the staggering valuation given the existing stock of gold, current prices make today's annual production of gold command about $160 billion. Buyers -- whether jewelry and industrial users, frightened individuals, or speculators -- must continually absorb this additional supply to merely maintain an equilibrium at present prices.
A century from now the 400 million acres of farmland will have produced staggering amounts of corn, wheat, cotton, and other crops -- and will continue to produce that valuable bounty, whatever the currency may be. Exxon Mobil (XOM) will probably have delivered trillions of dollars in dividends to its owners and will also hold assets worth many more trillions (and, remember, you get 16 Exxons). The 170,000 tons of gold will be unchanged in size and still incapable of producing anything. You can fondle the cube, but it will not respond.
Admittedly, when people a century from now are fearful, it's likely many will still rush to gold. I'm confident, however, that the $9.6 trillion current valuation of pile A will compound over the century at a rate far inferior to that achieved by pile B.
Our first two categories enjoy maximum popularity at peaks of fear: Terror over economic collapse drives individuals to currency-based assets, most particularly U.S. obligations, and fear of currency collapse fosters movement to sterile assets such as gold. We heard "cash is king" in late 2008, just when cash should have been deployed rather than held. Similarly, we heard "cash is trash" in the early 1980s just when fixed-dollar investments were at their most attractive level in memory. On those occasions, investors who required a supportive crowd paid dearly for that comfort.

My own preference -- and you knew this was coming -- is our third category: investment in productive assets, whether businesses, farms, or real estate. Ideally, these assets should have the ability in inflationary times to deliver output that will retain its purchasing-power value while requiring a minimum of new capital investment. Farms, real estate, and many businesses such as Coca-Cola (KO), IBM (IBM), and our own See's Candy meet that double-barreled test. Certain other companies -- think of our regulated utilities, for example -- fail it because inflation places heavy capital requirements on them. To earn more, their owners must invest more. Even so, these investments will remain superior to nonproductive or currency-based assets.
Whether the currency a century from now is based on gold, seashells, shark teeth, or a piece of paper (as today), people will be willing to exchange a couple of minutes of their daily labor for a Coca-Cola or some See's peanut brittle. In the future the U.S. population will move more goods, consume more food, and require more living space than it does now. People will forever exchange what they produce for what others produce.
Our country's businesses will continue to efficiently deliver goods and services wanted by our citizens. Metaphorically, these commercial "cows" will live for centuries and give ever greater quantities of "milk" to boot. Their value will be determined not by the medium of exchange but rather by their capacity to deliver milk. Proceeds from the sale of the milk will compound for the owners of the cows, just as they did during the 20th century when the Dow increased from 66 to 11,497 (and paid loads of dividends as well).
Berkshire's goal will be to increase its ownership of first-class businesses. Our first choice will be to own them in their entirety -- but we will also be owners by way of holding sizable amounts of marketable stocks. I believe that over any extended period of time this category of investing will prove to be the runaway winner among the three we've examined. More important, it will be by far the safest.
This article is from the February 27, 2012 issue of Fortune.
http://finance.fortune.cnn.com/2012/02/09/warren-buffett-berkshire-shareholder-letter/
Tuesday, 8 November 2011
4 Major Secular Bear Markets, Warren Buffett is buying

"There are three issues worth noting here plus one important caveat:
1. The long 10-20 year secular bear moves seem to have lots of major rallies and sell offs; the ups and downs are intense, but make little in the way of net progress. After 15 years, the average secular bear is essentially unchanged.
2. The roller coaster ride leaves investors psychologically exhausted. They come to forget the good times of so long ago, and believe there is no way out of the morass. Naturally, they are reluctant to believe in the new bull market once it begins.
3. The major bottom seems to occur about halfway through; this implies that the March 2009 lows will not be revisited (note I only wrote IMPLY and not guarantee or forecast!) If we look at the current Bear versus the ’66-’82 (with lows like ’73-’74), it suggest that 8500-9000 on the Dow is possible, but barring another crisis 6500 is much less likely. And it also suggests that the next secular bull might begin around 2016-18.
Now for the caveat: We have but one century of data, and within that 100 year span, only four examples of long term secular bear markets. We really need 500-1000 years of data, 20-40 secular bears during the era of modern capital markets. That would allow us greater confidence that these four patterns aren’t merely coincidences.
See you around 2900 to validate the data . . ."
The good news is that if the above graph is an indication, the secular bear market might soon be over in the US, which has implications for the Global share market as well. But the end of the bear market also might still be a few years away.
Warren Buffett has started to buy in a pretty big way. Getting the timing right is simply impossible, but in general when he buys there is profit to be made, although it might be on the horizon, and there might be moments in the future where shares are cheaper.
Buffett Broadens Portfolio by Spending $23.9 Billion
"Warren Buffett’s Berkshire Hathaway Inc. (BRK/A) invested $23.9 billion in the third quarter, the most in at least 15 years, as he accelerated stock purchases and broadened the portfolio beyond consumer and financial-company holdings."
Subscribe to:
Posts (Atom)